From Sensor to Dashboard: How an IoT System Works
A layer-by-layer explanation of how data moves from physical sensors to APIs, storage, dashboards, and operator decisions in a practical IoT system.
- Sensors
- Telemetry
- MQTT
- HTTP
- Dashboards
- Firmware
- Published
- Updated
- Reading time
- 4 min read
- Author
- Saroj Chaudhary
- Role
- IoT & Embedded Systems Engineer
Many IoT ideas are described as “a sensor project,” but a useful system is never just the sensor. It is a chain of decisions that starts with physical measurement and ends with someone being able to understand or act on the data.
If you are planning a prototype, it helps to think in layers. That is also how IoT system development work usually becomes easier to scope: instead of seeing one giant problem, you break it into handoffs.
1. Sensor layer
The sensor layer is where the physical world first touches the system. Temperature, moisture, air quality, motion, current, position, or switch-state signals all start here.
What matters at this layer is not just the sensor model. It is also:
- how often you need to sample
- what level of accuracy is acceptable
- whether the environment is dusty, wet, noisy, or exposed
- how calibration and placement affect the reading
In other words, “which sensor should I buy?” is usually too small a question. The better question is: “what measurement is operationally useful?”
2. Embedded device layer
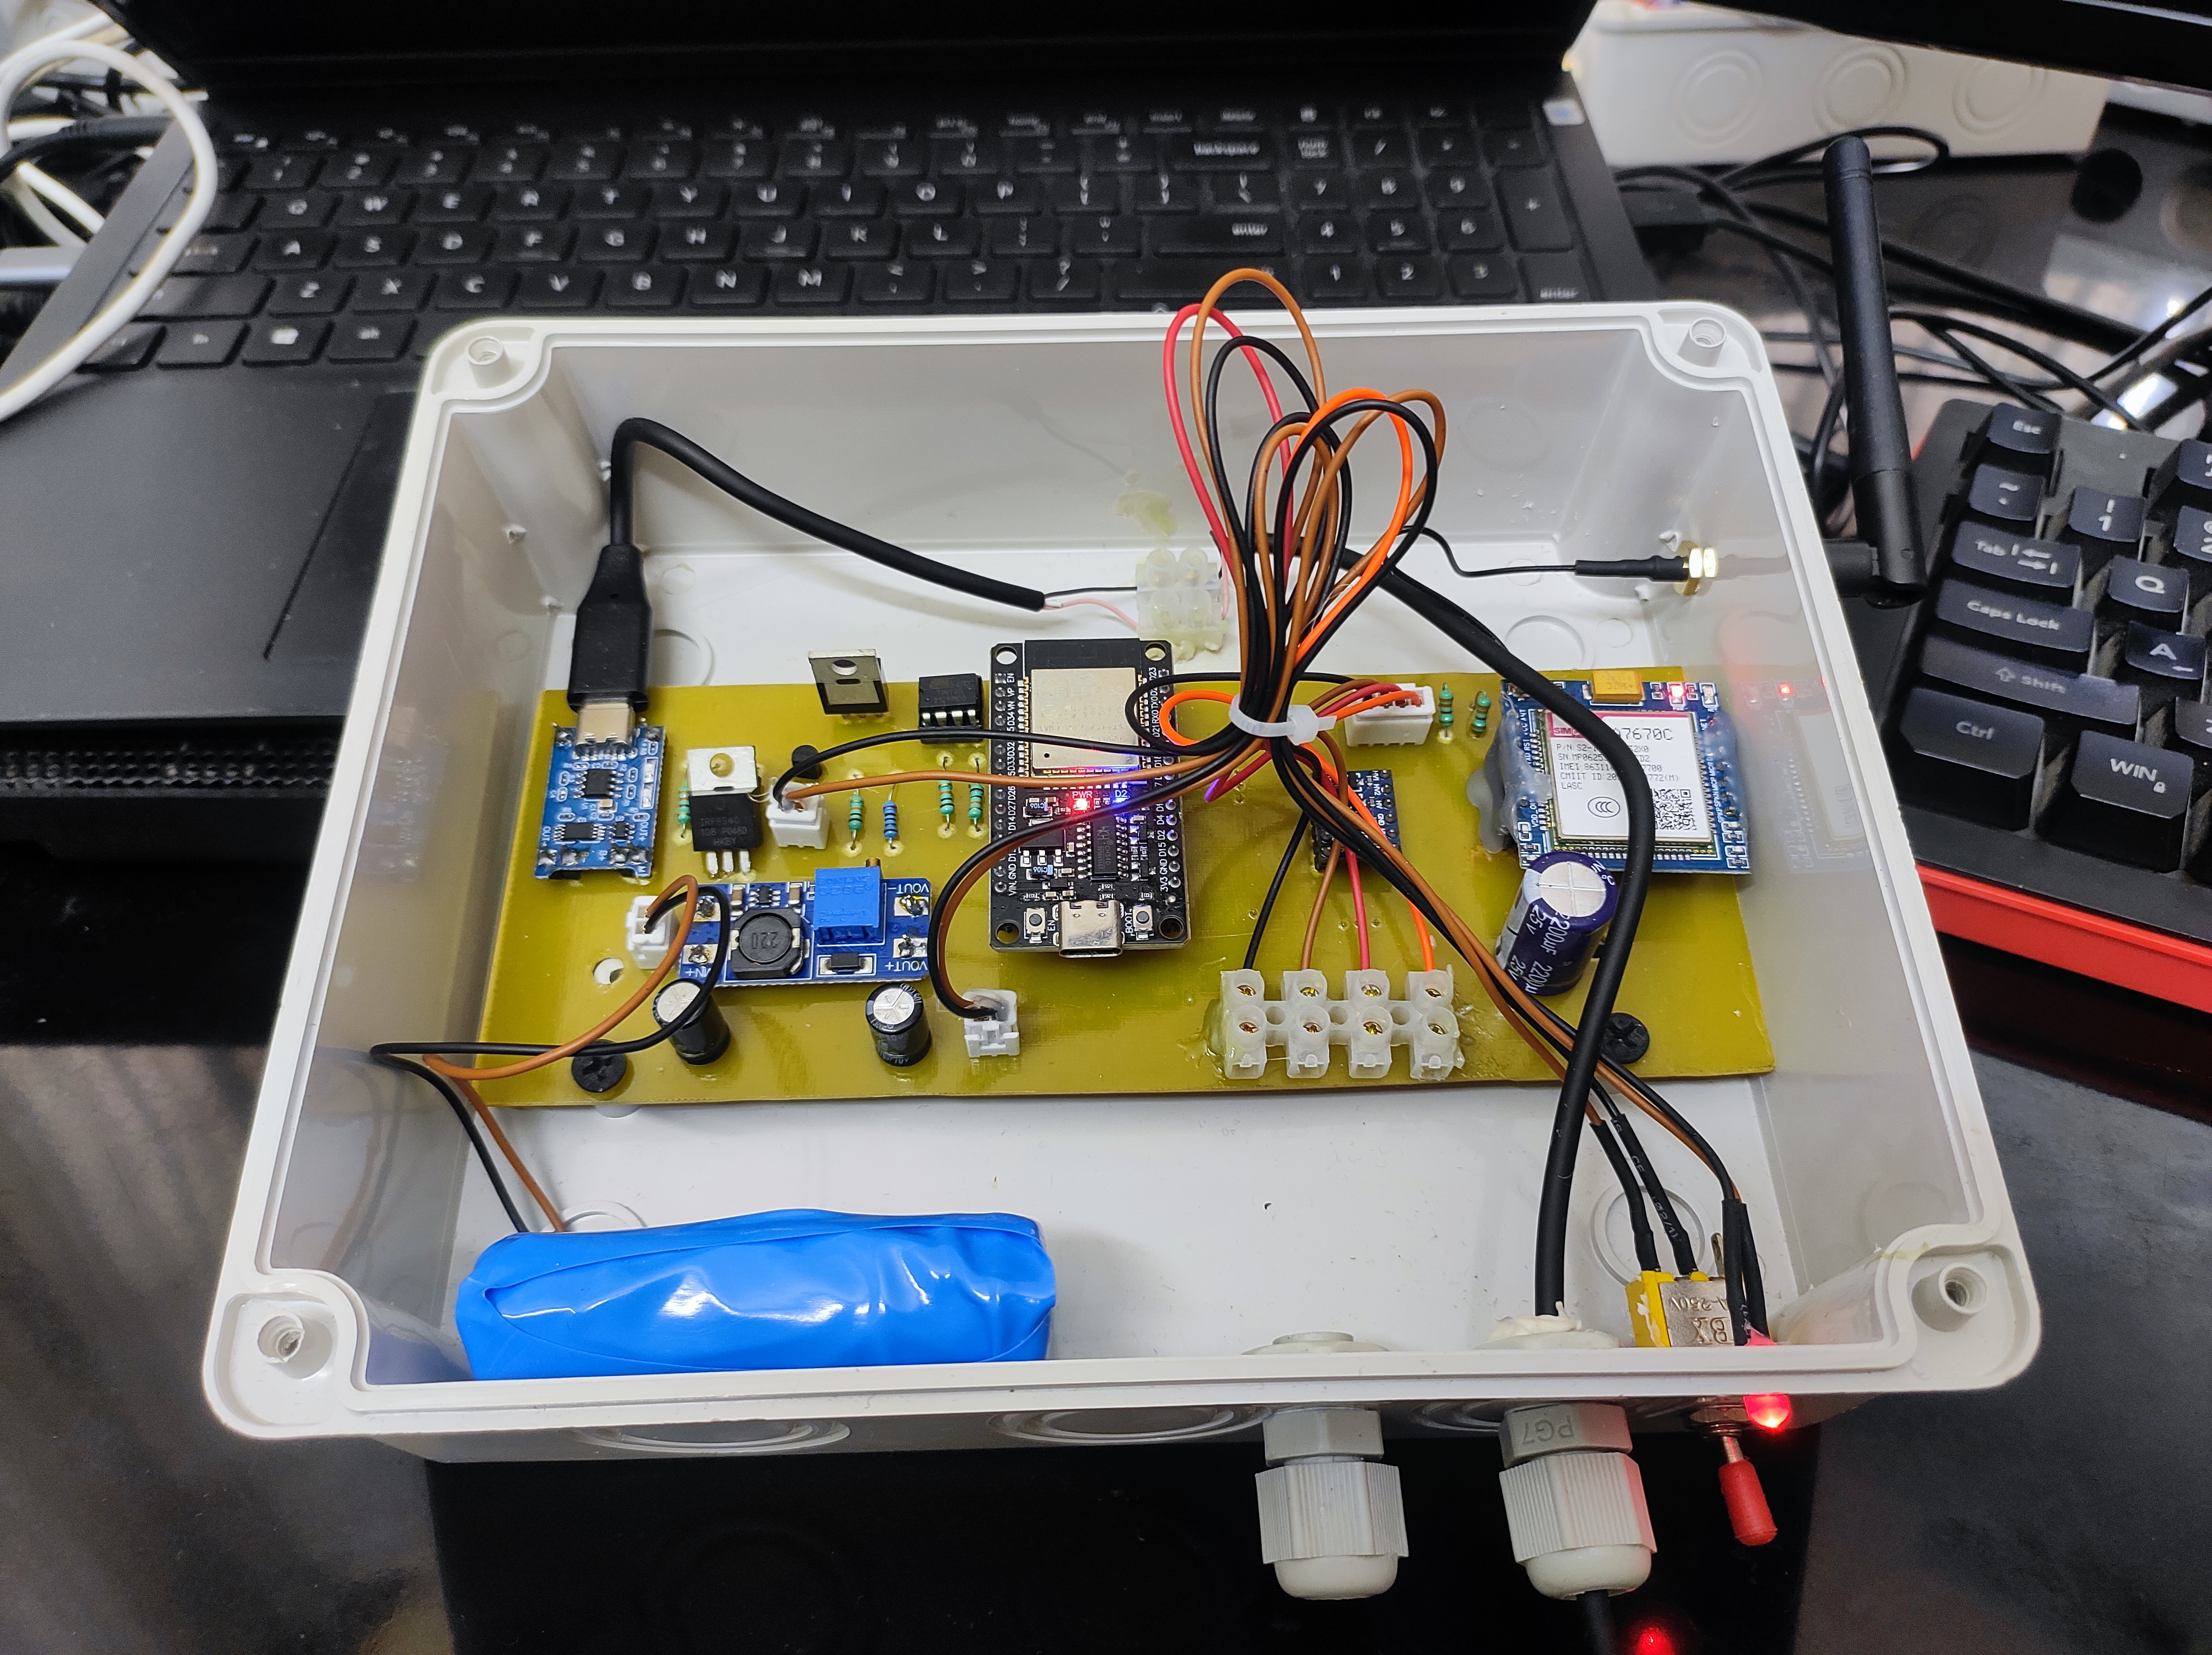
The embedded device reads the sensor, applies timing rules, handles local logic, and prepares data for transmission. This is where the firmware earns its keep.
The device layer often has to decide:
- when to wake up
- which measurements to keep
- how to format a payload
- what to do when communication is unavailable
- whether local control should continue when the internet disappears
For example, a remote environmental node might not send every raw measurement immediately. It may aggregate, timestamp, and buffer locally before sending a smaller packet upstream.
3. Connectivity layer
Once the device has useful data, it needs a communication path. This is where connectivity planning becomes a system concern rather than a component choice.
The transport could be Wi-Fi, GSM/LTE, LoRa, BLE through a phone, or a gateway path. What matters is whether the link fits the environment and the data rhythm.
This is why the connectivity layer should not be chosen in isolation. A high-frequency dashboard, battery-powered field node, and mobile installation all create very different constraints.
4. API or broker layer
After the data leaves the device, it usually arrives at an ingestion layer. That might be:
- an HTTP API
- an MQTT broker
- a gateway service
- a local edge process that forwards data later
This layer validates, routes, and normalizes incoming data so the rest of the software can depend on a stable structure.
Here is a small example of the kind of payload shape that keeps downstream systems easier to work with:
{
  "deviceId": "node-07",
  "capturedAt": "2026-08-06T09:15:00Z",
  "metrics": {
    "temperatureC": 26.4,
    "humidityPercent": 58.2,
    "batteryVoltage": 3.92
  },
  "health": {
    "signalQuality": "moderate",
    "bufferedRecords": 3
  }
}
The point is not the exact JSON. The point is that the software layer should receive a consistent contract instead of guessing how each device packet is shaped.
5. Storage layer
Once the data is accepted, the system needs somewhere to keep it. The storage choice depends on how the data will be used later.
Sometimes recent state is enough. Other times the value comes from history: trend lines, fault analysis, or comparing one site against another. That is why a monitoring system often needs both current status and historical records.
A storage layer that is easy to write into but hard to query later becomes a hidden problem. This is one reason IoT dashboards and platforms should not be treated as an afterthought; the data model and the interface layer influence each other.
6. Dashboard layer
The dashboard is where the system becomes useful to an operator, researcher, or client. It answers questions like:
- what is happening right now?
- what changed over the last day?
- which devices stopped reporting?
- where do readings look abnormal?
The dashboard is not “just UI.” It is the decision surface of the system.
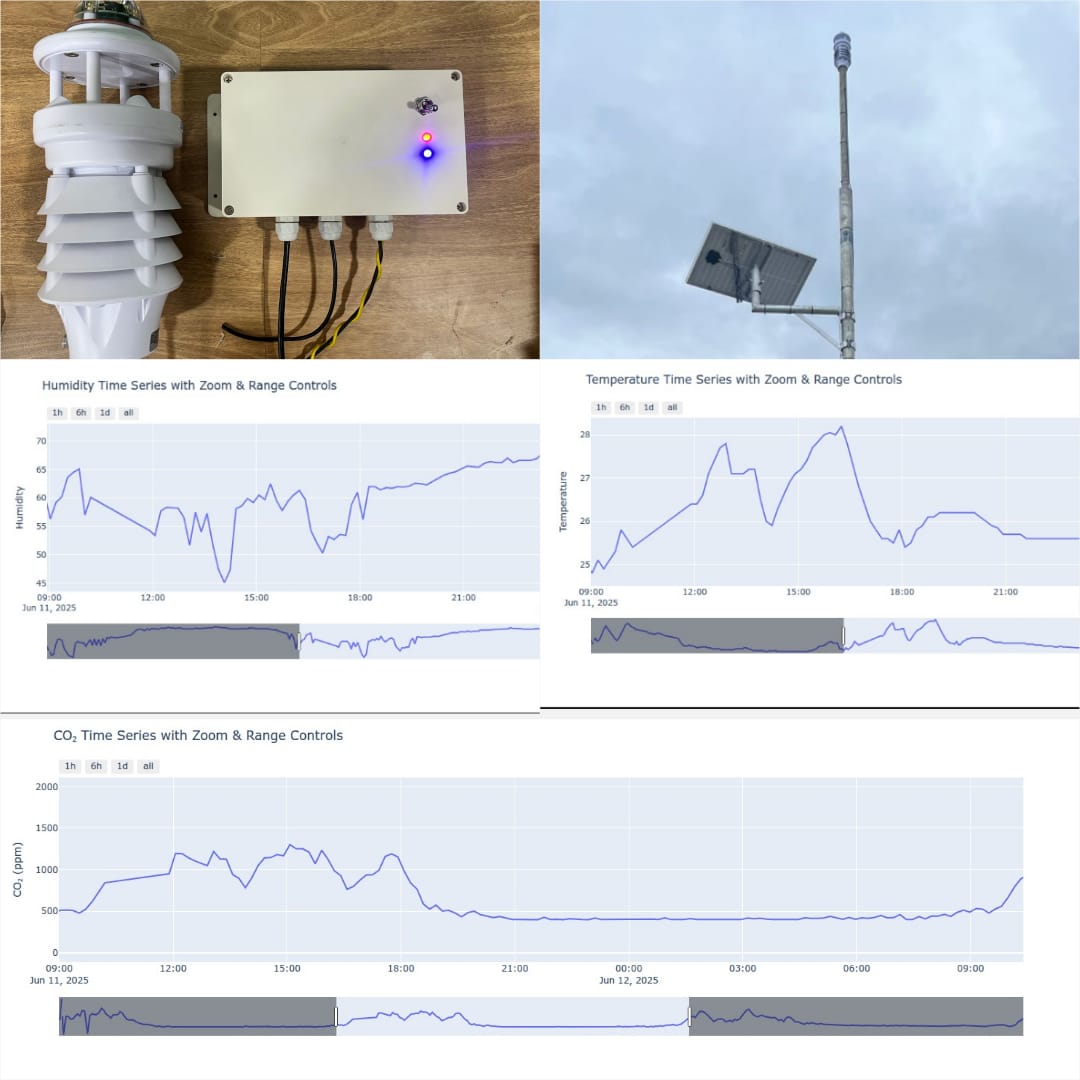
In projects like the solar-powered weather and air-quality monitoring station, the dashboard layer matters because the field site is harder to visit than the graph is to inspect. If the dashboard cannot show data freshness, battery condition, and recent trend context, it becomes hard to trust the deployment.
Where early prototypes often go wrong
Teams frequently build one layer well and ignore the handoff to the next layer. Common examples include:
- accurate sensors with poor payload structure
- working device firmware with no buffering strategy
- usable dashboards that hide data staleness
- backend ingestion that stores everything but explains nothing
A simple way to think about the whole path
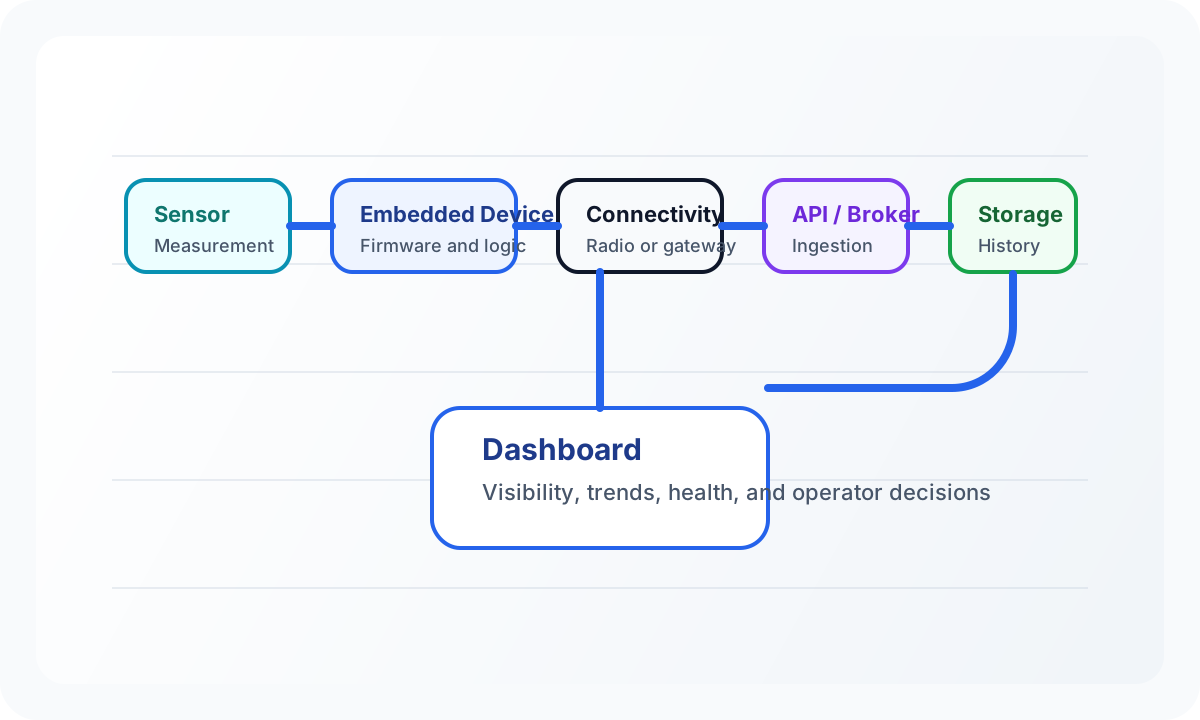
Sensor → embedded device → connectivity → API or broker → storage → dashboard
That chain is simple enough to draw on a whiteboard, but rich enough to expose most system problems early. If one link in the chain is weak, the rest of the stack has to compensate for it.
That is why a practical IoT system should be planned as a complete flow, not as a pile of disconnected parts.